At the crossroad
Article written by Gocar Data – The analysis and opinions expressed in this article are those of the author only and not those of OPENLANE Europe.
In Gocar Data’s last market analysis, they highlighted the perspectives for the new year. They described a rise in the volumes, but still below the situation compared to the same time last year. Gocar Data shows a rise for all six OPENLANE Europe markets regarding the prices. And last but not least, they explained the indicators for the rotation, showing two extremes: some vehicles selling fast, others being harder to sell.
After a complete quarter in 2022, they have tracked those trends further.
Pricing: still rising
Price is clearly the most defined trend. In the first quarter, all markets have an average selling price going up. For professionals, most markets have an increase between 3% and 7%. Only Italy remains flat, with no increase at all. However, when comparing the average price for vehicles sold by professionals at the same date last year, the increase is at a minimum of 14% (France) and a maximum of 22% for the German market!
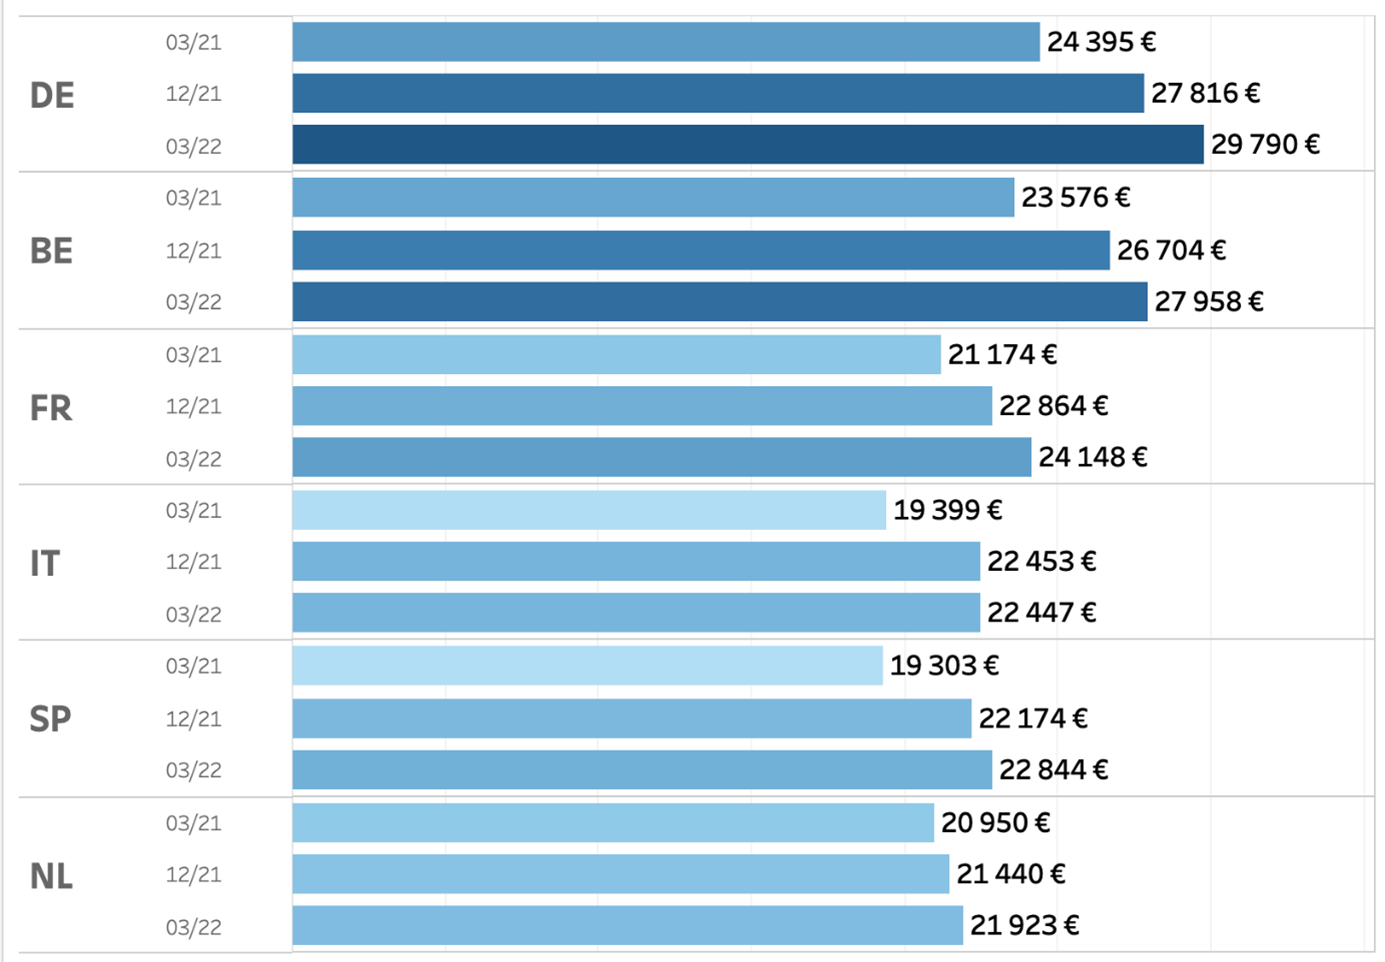
Graph: average price evolution
This trend kept going up between March and May, except for the Belgian market. Spain had the highest increase.

Graph: average price evolution update May
Volumes: positive trend, despite everything
As analyzed at the end of 2021, the volumes of available cars in the Gocar Data market observation were going up, but remained below the levels at the same date a year before. This is still the case after the first quarter, even if the rise is slowing down.
For the total of the six analyzed markets (BE, DE, NL, FR, SP & IT), the volume is almost 3% higher compared to three months ago. However, we see different situations: the Netherlands and Italy have the highest growth, while Belgium and France are going down.
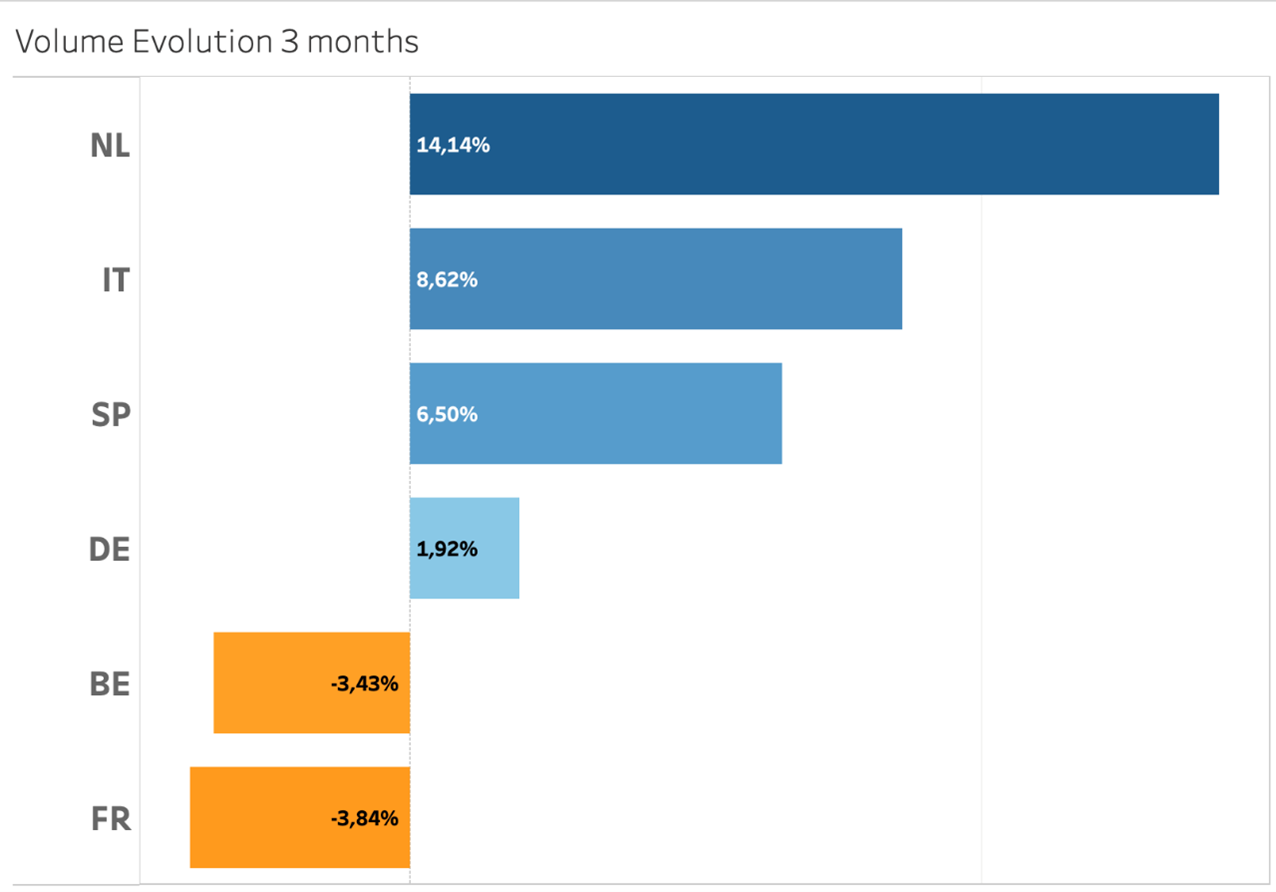
Graph: volume compare 3 months
And just like at the end of last year, the situation year-to-date is still deeply lower, with Belgium and Germany facing the steepest descent.
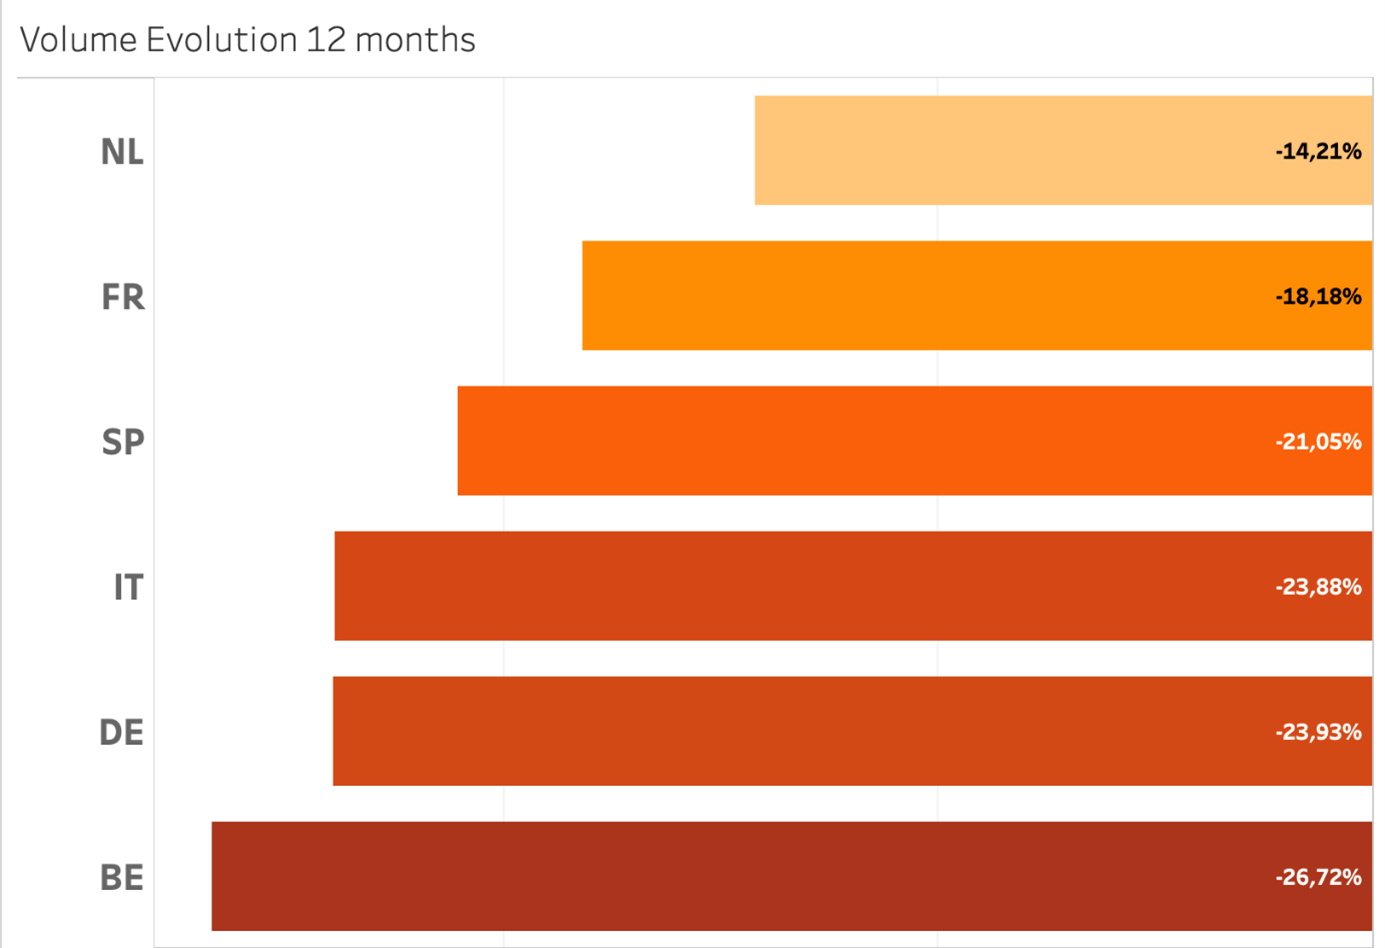
Graph: volume compare 12 months
The raise continues between March and May. Overall, on the six markets, the online stock raised by 5,1%. Italy, Germany & Belgium have the highest raise, while The Netherlands and Spain are descending.
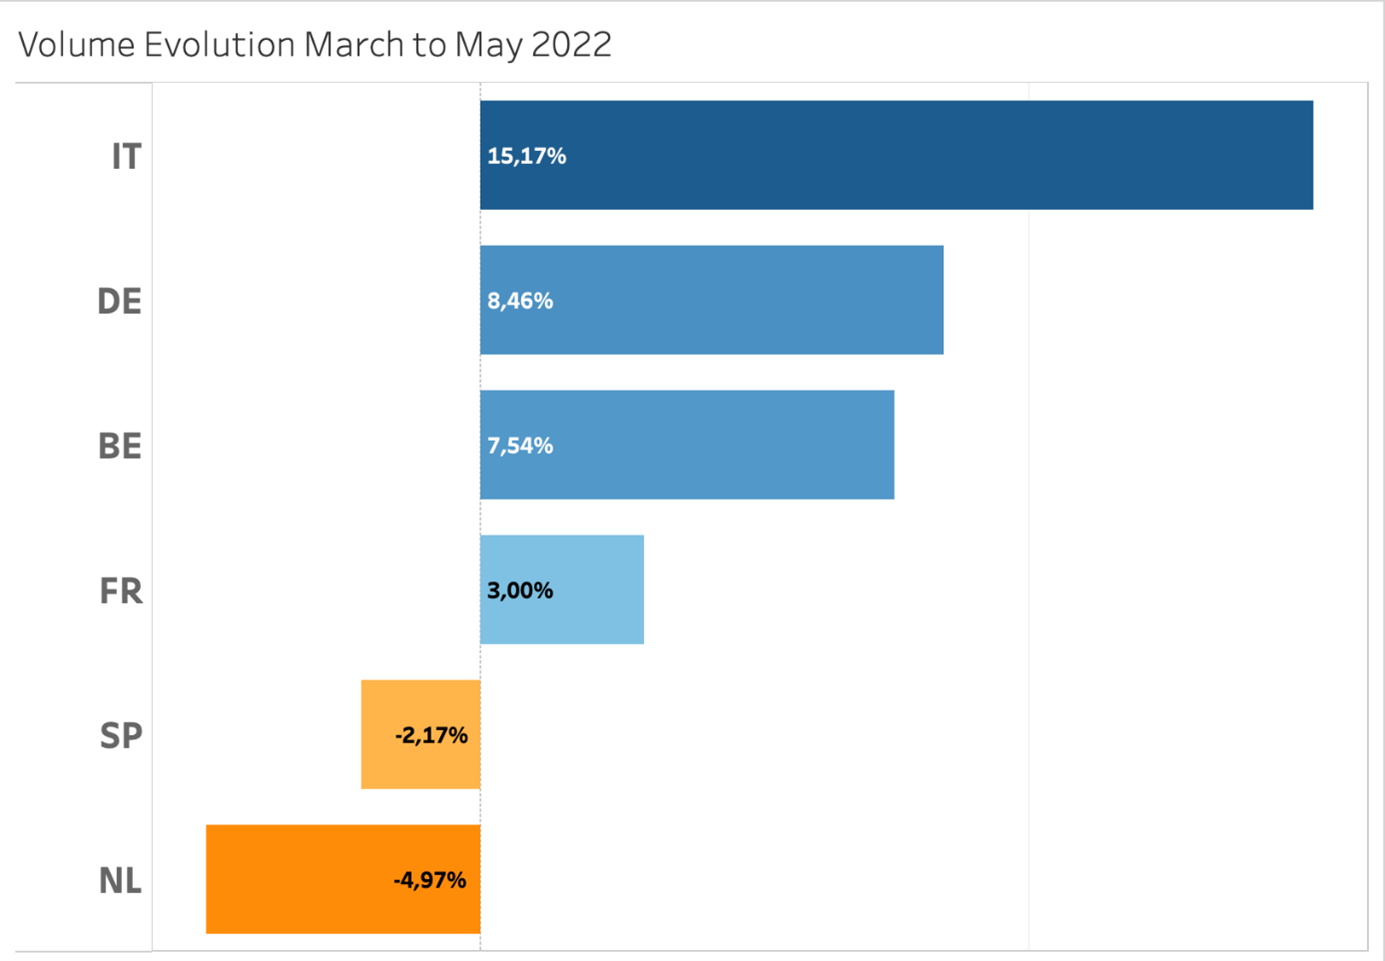
Graph: Volume evolution march to may
Rotation: still improving
The average publication time for professionals is either improving or stable for all markets. In average, all markets are below 60 days.
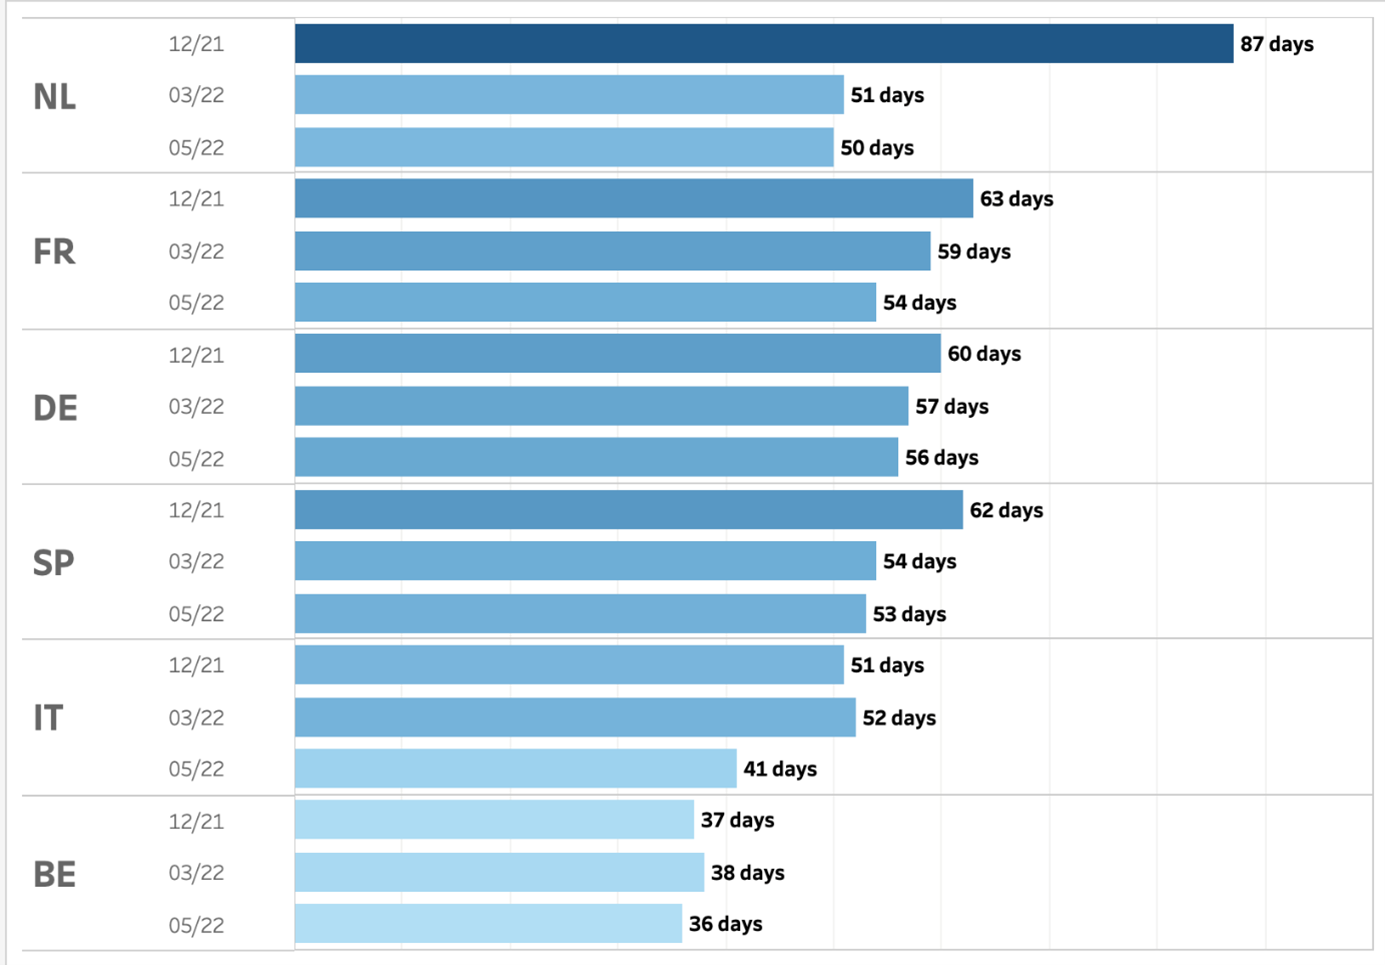
Graph evolution publication days 5 months
Overall, Gocar Data has a positive alignment of the different KPI’s they are following. More cars, better prices, faster sales than five months ago. These are all positive messages. Unfortunately, they can already mitigate those with the knowledge that the situation in Europe is now facing more turmoil after the COVID-19 crisis, the delays of new car deliveries and the emerging impacts of global conflict. It’s too soon to see the effect in the data yet, but Gocar Data can already expect further delays in car manufacturing and economic consequences. As the situation seems impossible to predict, we all need more than ever to follow the evolution of the markets to make the right decisions, day after day.